Study Summary
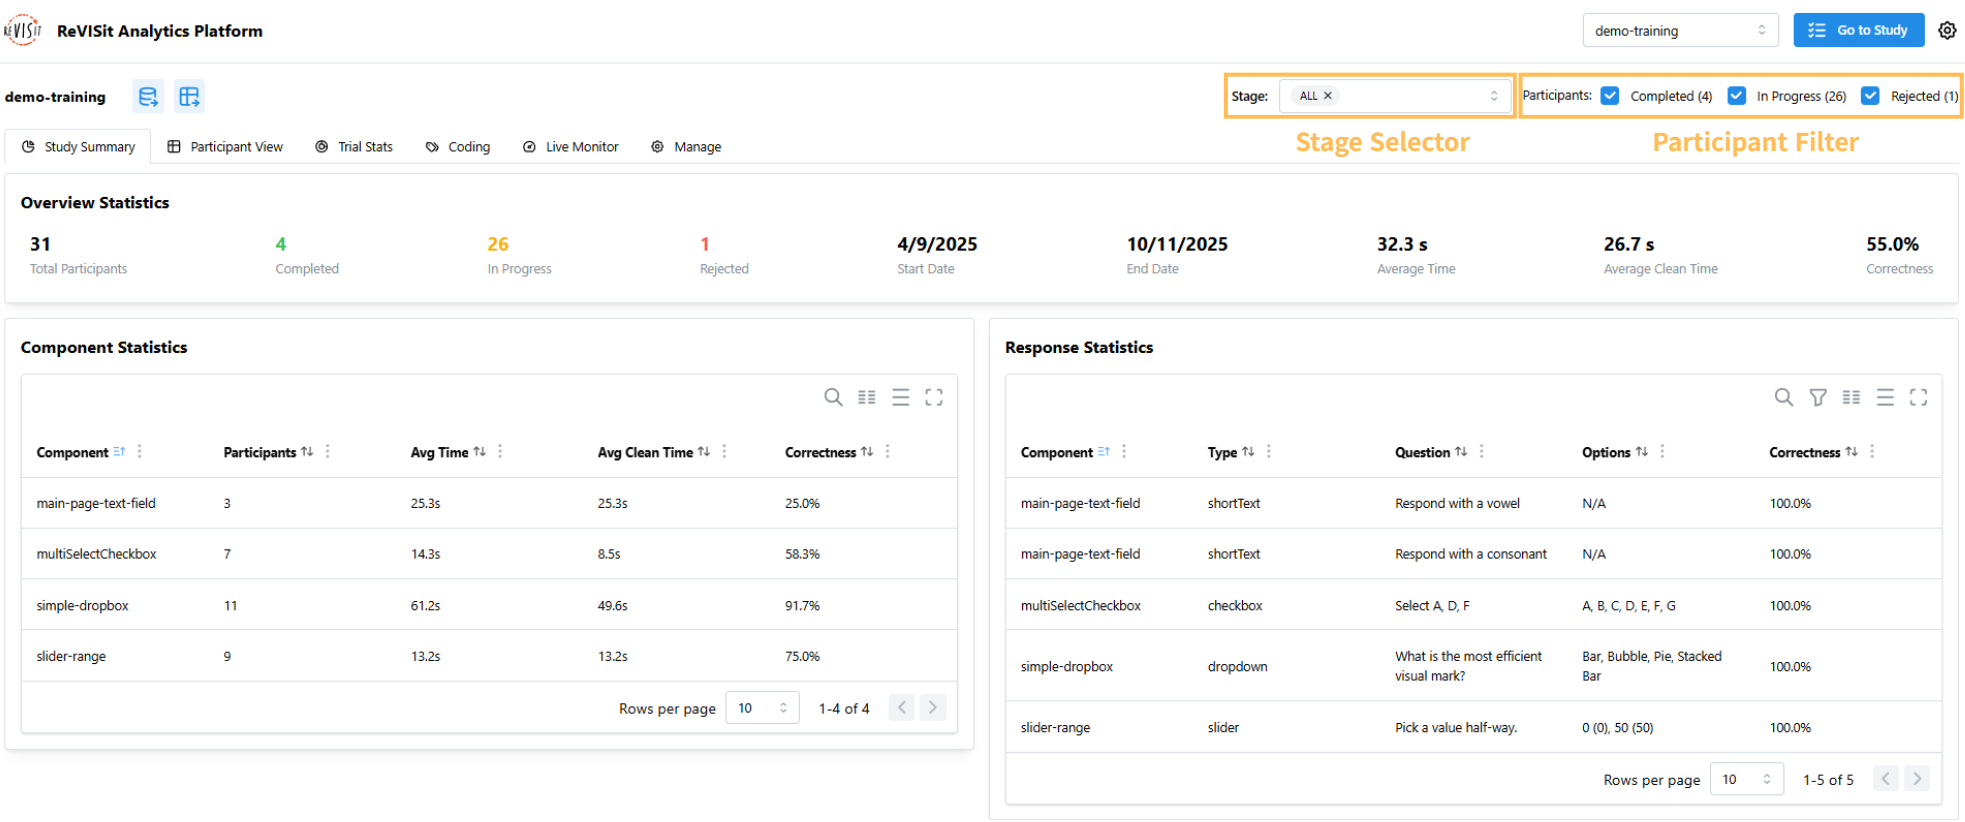
The study summary gives users a quick overview of their study at a glance. It provides a comprehensive overview of their study data in a single, easy-to-understand dashboard.
The summary is organized into three main sections: Overview Statistics, Component Statistics, and Response Statistics. At the top, participant filters allow you to filter the analysis by including or excluding completed, in-progress, or rejected participants. A stage selector is also available for filtering different study stages. For more details on stage management, see here.
Overview Statistics
This section shows key numbers about the study.

- Total Participants – total number of people in the study
- Completed / In-Progress / Rejected – counts of participants by status (green = completed, yellow = in-progress, red = rejected)
- Start Date / End Date – when the first participant started and the last one finished the study
- Average Time – average time participants spent on the study
- Average Clean Time – average time spent without browsing away from the study
- Correctness – overall percentage of correct answers
Window visibility events are sometimes unreliable and may not fire consistently in certain browsers or situations. When clean time cannot be calculated reliably, the system sets the value to -1 to indicate an issue with the calculation.
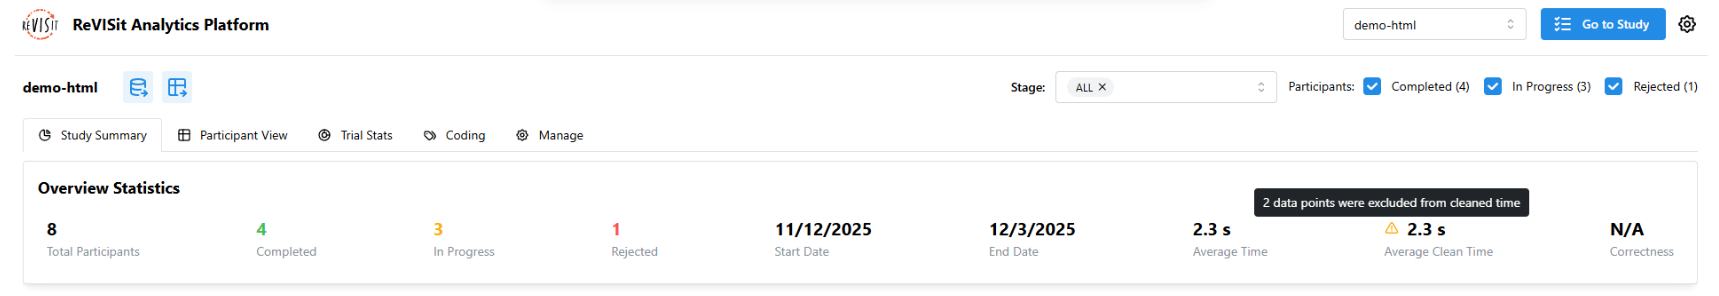
For example, a warning icon may appear next to Average Clean Time in the Overview Statistics. Hovering over the clean time value shows how many data points were excluded from the overall clean time calculation.
Component Statistics
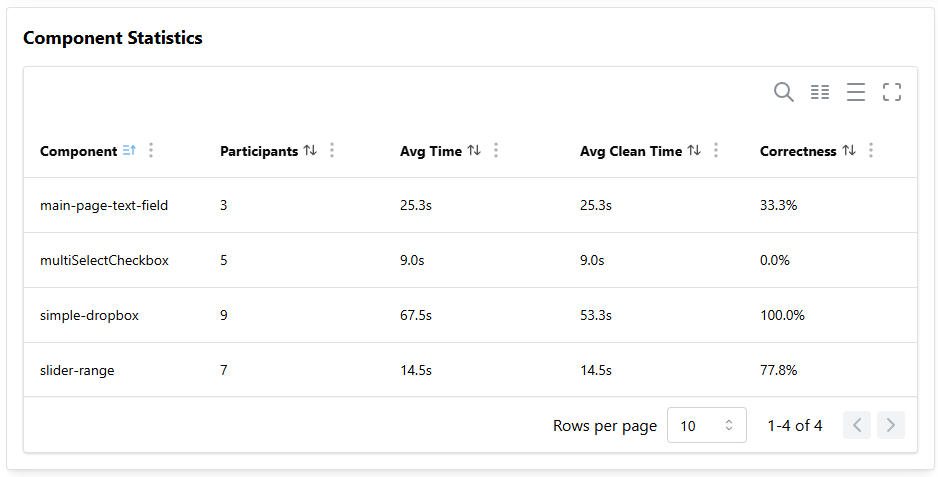
This section shows each part of the study in a table you can sort, filter, and search.
- Component – name of the study part
- Participants – number of people who did this part
- Average Time – average time spent
- Average Clean Time – average time without browsing away
- Correctness – percentage of correct answers (shows N/A if the component has no correct answer)
Response Statistics
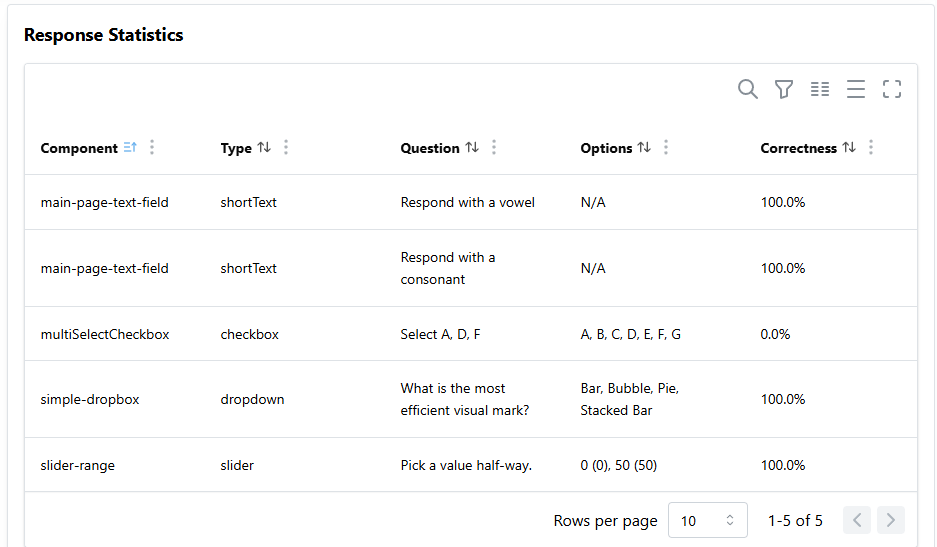
This section provides details for each question, with each row representing a single question.
- Component – part of the study with this question
- Type – kind of response (see BaseResponse for all response types)
- Question – question prompt
- Options – answer options given to the participants
- Correctness – percentage of correct answers