Data Export and Basic Analysis
Download as Tidy CSV
ReVISit allows you to export data in Tidy format for analysis in Python notebooks or R.
The exported tidy data includes all the responses from the participants, including the participant ID, trial ID, trial order, and response ID. Additionally, we provide the parameters and correct answers that were set in the study configuration file (or by dynamic block). This data can be used to analyze the performance of participants, the accuracy of responses, and the time taken to complete the study.
The tidy data is missing some data that is available in the JSON download, such as the provenance graphs. If you need this data, you can download the JSON data and parse it in your analysis platform, instead of using this Tidy data.
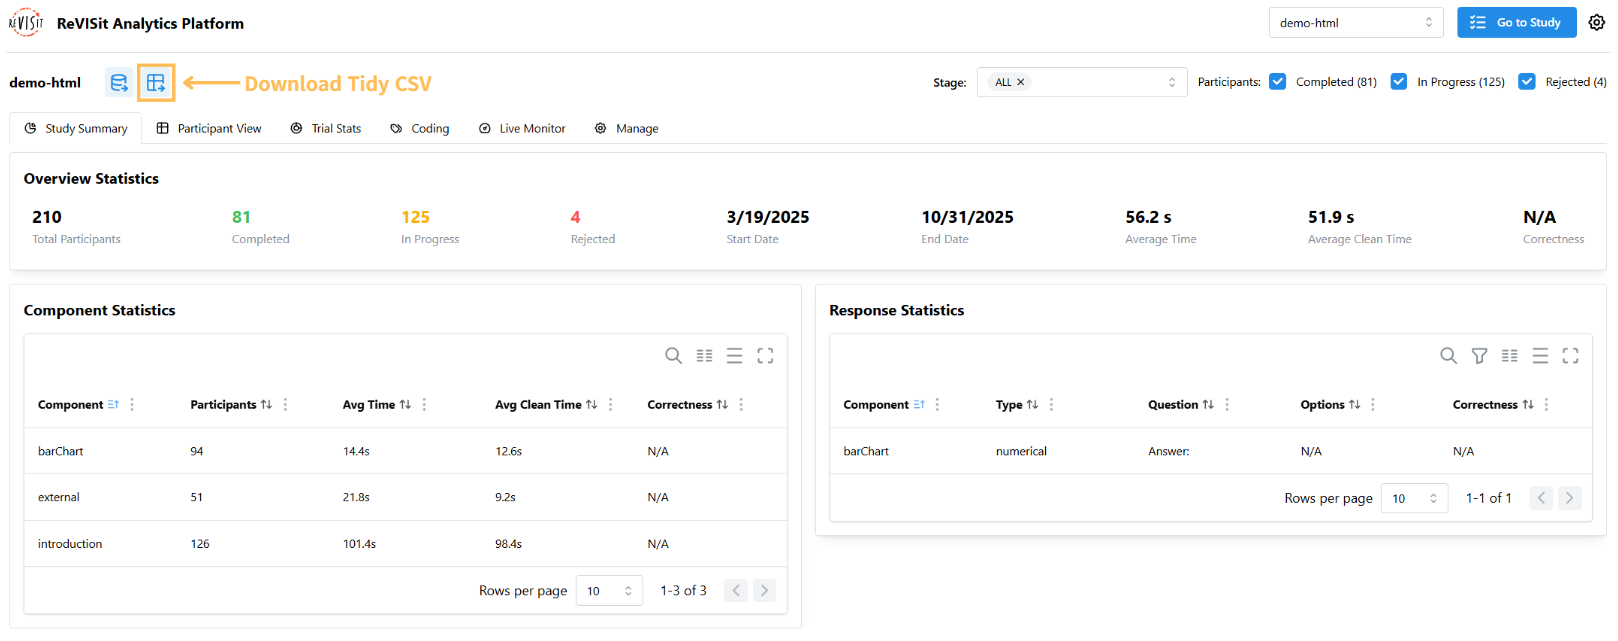
Steps to Download Data
-
Navigate to the Analysis platform for the current study.
-
Open the Participant View, then click on the Download as tidy CSV button. Here's a direct link for the example below.
-
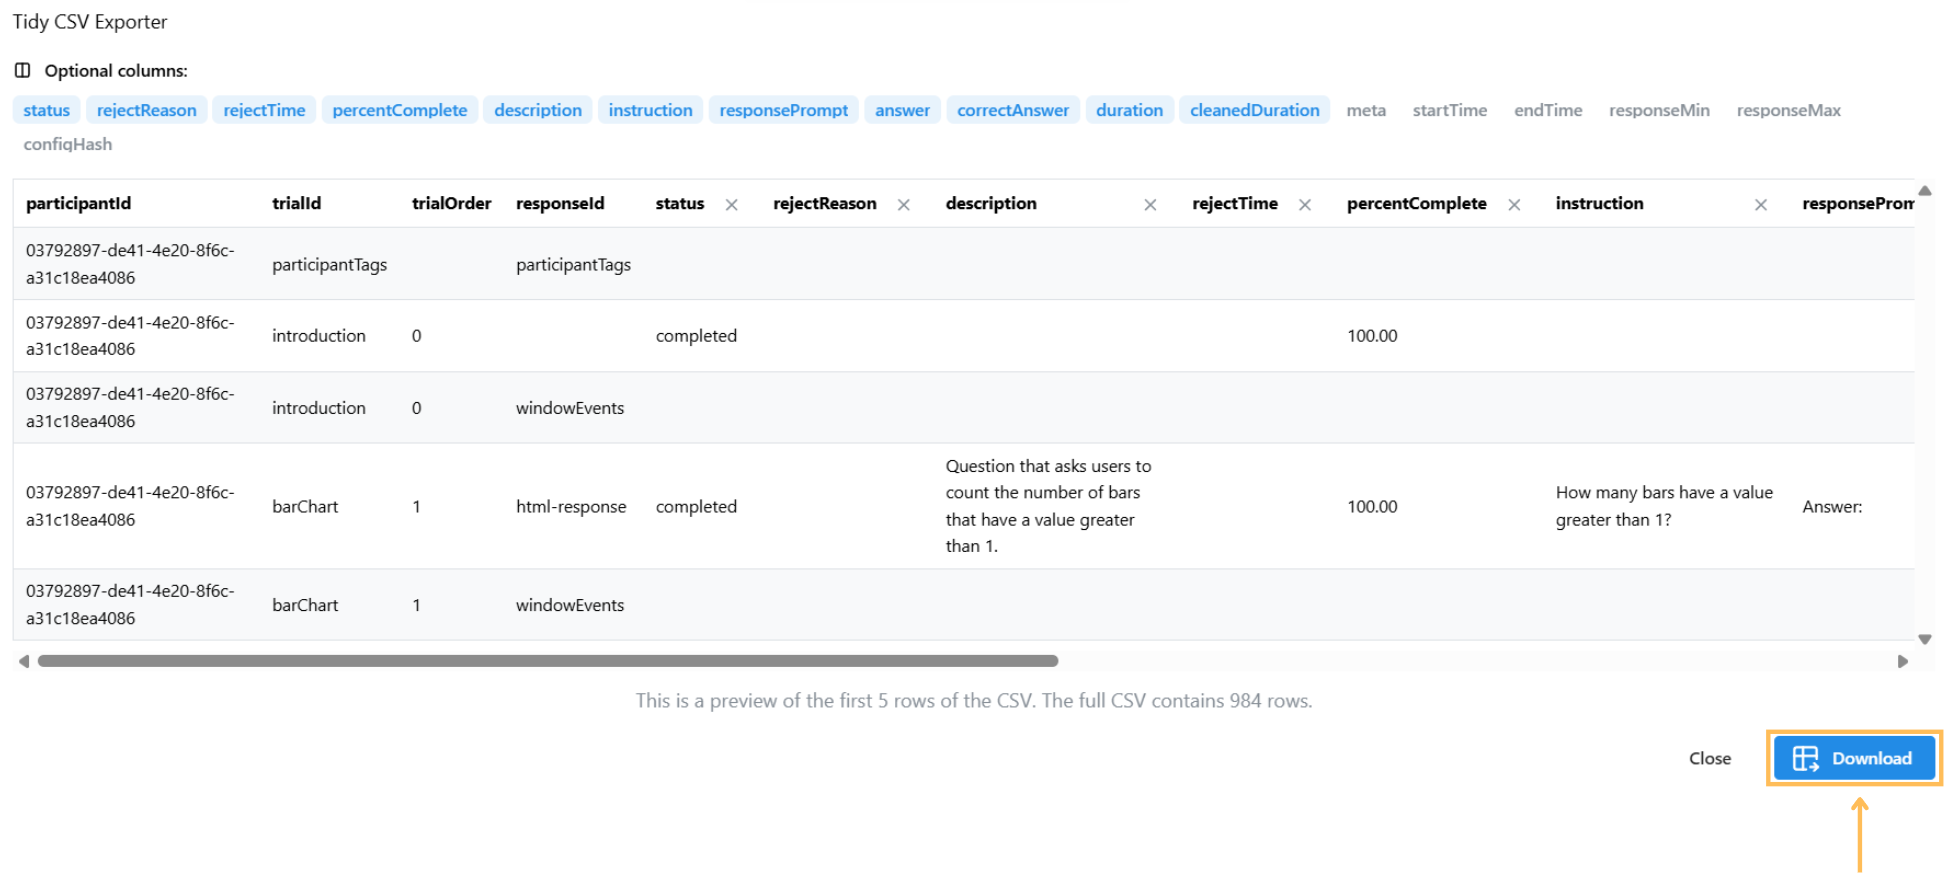
The CSV Exporter will open, where you can select the columns to export. A preview of the first five rows of the output CSV will be displayed.
-
Once ready, click the Download button at the bottom right.
After downloading the Tidy data, you can import it into your favorite analysis platform for further analysis. Below is an example of how to work with exported data from the Interactive Selections in Scatterplot study in R.
:::info What is Tidy data format? Tidy data format is a structured approach to organizing tabular data where each variable is a column, each observation is a row, and each type of observational unit is a separate table. You may check more details here. :::
If your study includes audio recording, you can optionally include a transcript column in your tidy CSV export. This column contains the transcribed text from each trial, making it easy to analyze what participants said alongside their responses. You must be using Firebase as your storage engine and have the Google Cloud Speech-to-Text extension configured for your project.
Downloading transcripts for large datasets can take significant time. If you're downloading data for 50 or more participants with transcripts, you'll see a warning about potential delays. The system fetches transcripts with concurrency limits to avoid overwhelming the browser.
Example Workflow in R
1. Install Necessary Packages
list.of.packages <- c("ggplot2", "Hmisc")
new.packages <- list.of.packages[!(list.of.packages %in% installed.packages()[,"Package"])]
if(length(new.packages)) install.packages(new.packages)

library(ggplot2)
2. Read and Preview the Data
df <- read.csv("data/example-brush-interactions_all_tidy.csv")
head(df)
| participantId | trialId | trialOrder | responseId | |
|---|---|---|---|---|
| 1 | 017ab8bd-33d1-4f95-ac07-5fedef30928a | introduction | 0 | prolificId |
| 2 | 017ab8bd-33d1-4f95-ac07-5fedef30928a | consent | 1 | signature |
| 3 | 017ab8bd-33d1-4f95-ac07-5fedef30928a | consent | 1 | accept |
| 4 | 017ab8bd-33d1-4f95-ac07-5fedef30928a | paintBrush_q1 | 5 | response |
| 5 | 017ab8bd-33d1-4f95-ac07-5fedef30928a | paintBrush_q2 | 6 | max-response |
3. Filter Data for Task q2
q2 <- subset(df, grepl("_q2", trialId) & status == "completed")
q2$isCorrect <- ifelse(q2$answer == q2$correctAnswer, 1, 0)
4. Create a Violin Plot
The plot displays correct answers on the right and incorrect answers on the left.
ggplot(q2, aes(x = isCorrect, y = trialId)) +
  geom_violin(aes(fill = trialId), color = "#888", alpha = 0.7) +
  stat_summary(fun.data = "mean_cl_boot", colour = "#333", size = 0.5, alpha=0.5) +
  theme_minimal() +
  theme(legend.position = "none") +
  labs(
    title = "Violin Plot for q2 (Finding most/least value)",
  )
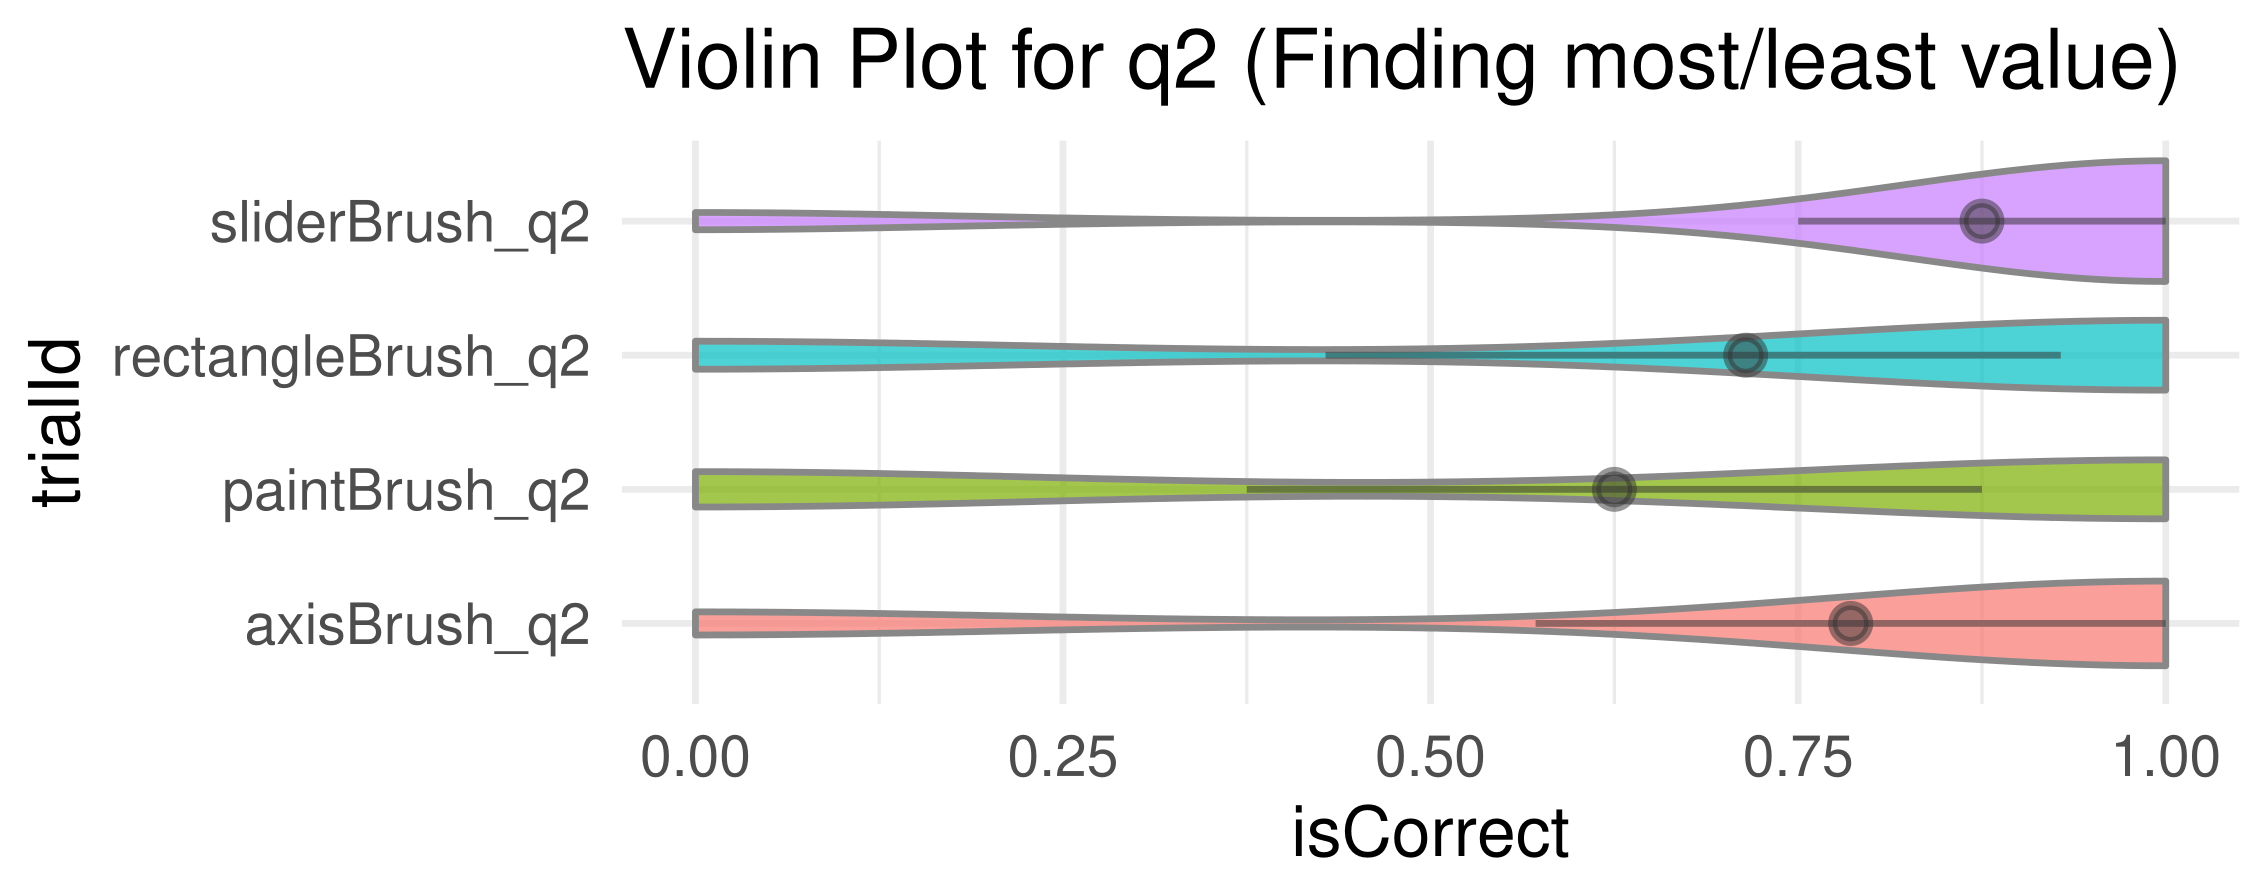
We find accuracy using paint brush technique is much less than that of the others.
5. Export the generated plot.
ggsave("plot.pdf", width = 5, height = 2, units = "in")
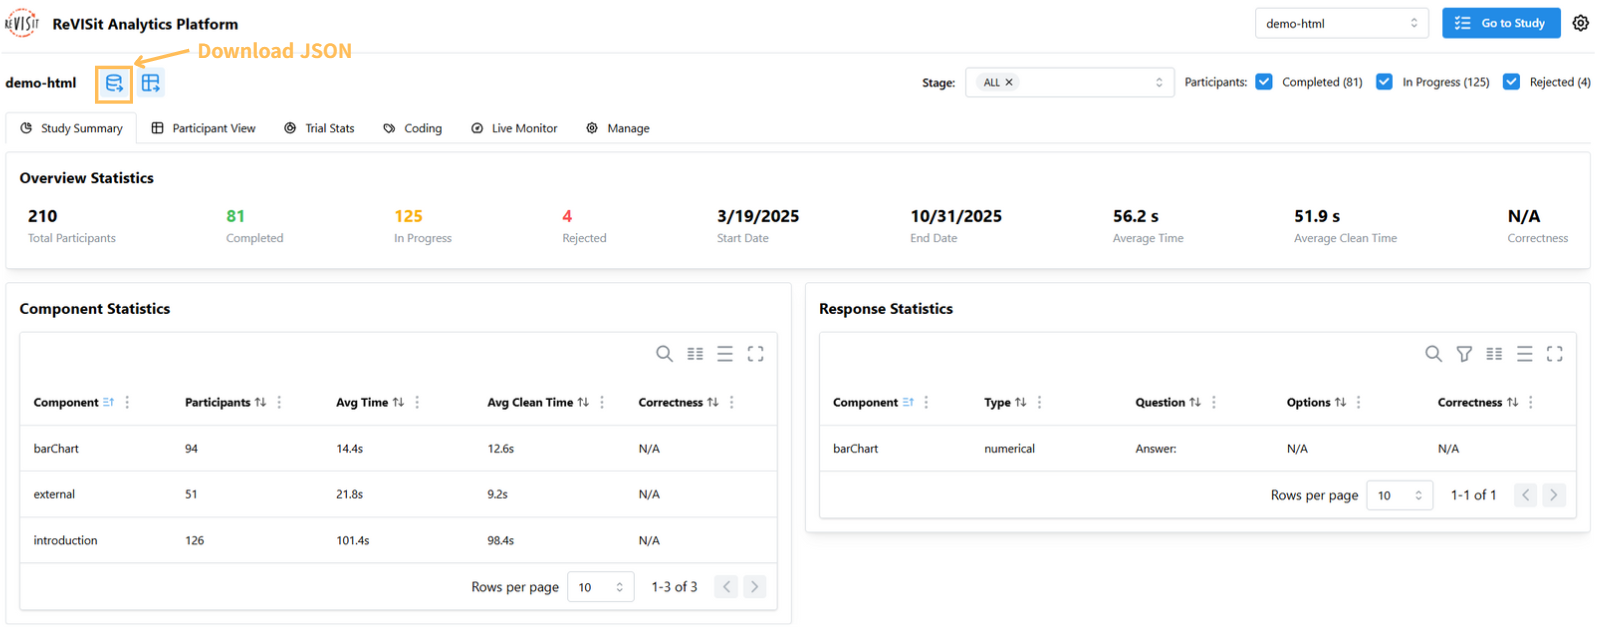
Download as JSON
Steps to Download Data
-
Navigate to the Analysis platform for the current study.
-
Open the Participant View, then click on the Download as JSON button.
Download Audio
There are two ways to download audio files if you have enabled recordAudio: true in your study. For applying Think Aloud in your study, please visit Think Aloud.
Download Participants' Audio
-
Navigate to the Analysis platform for the current study.
-
Open the Participant View, then click on the Download participants audio button.
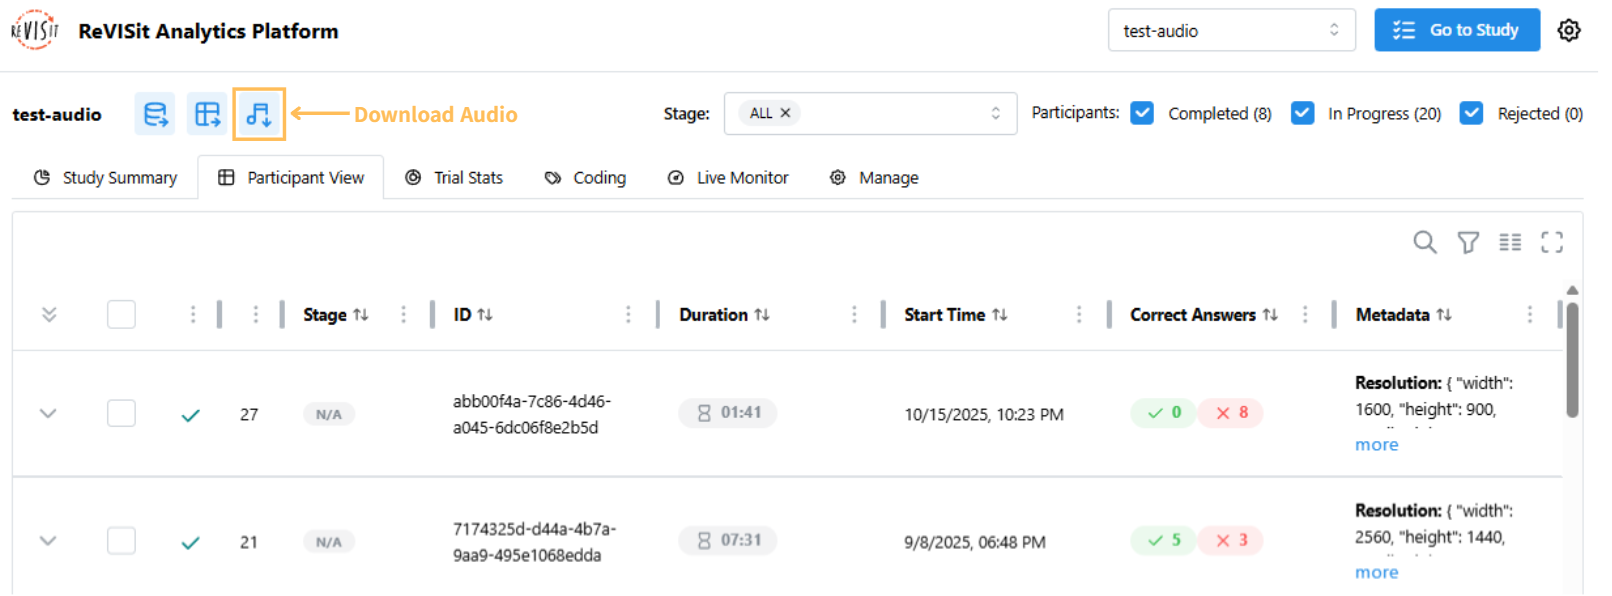
To download audio from specific participants, select the participants in the table.
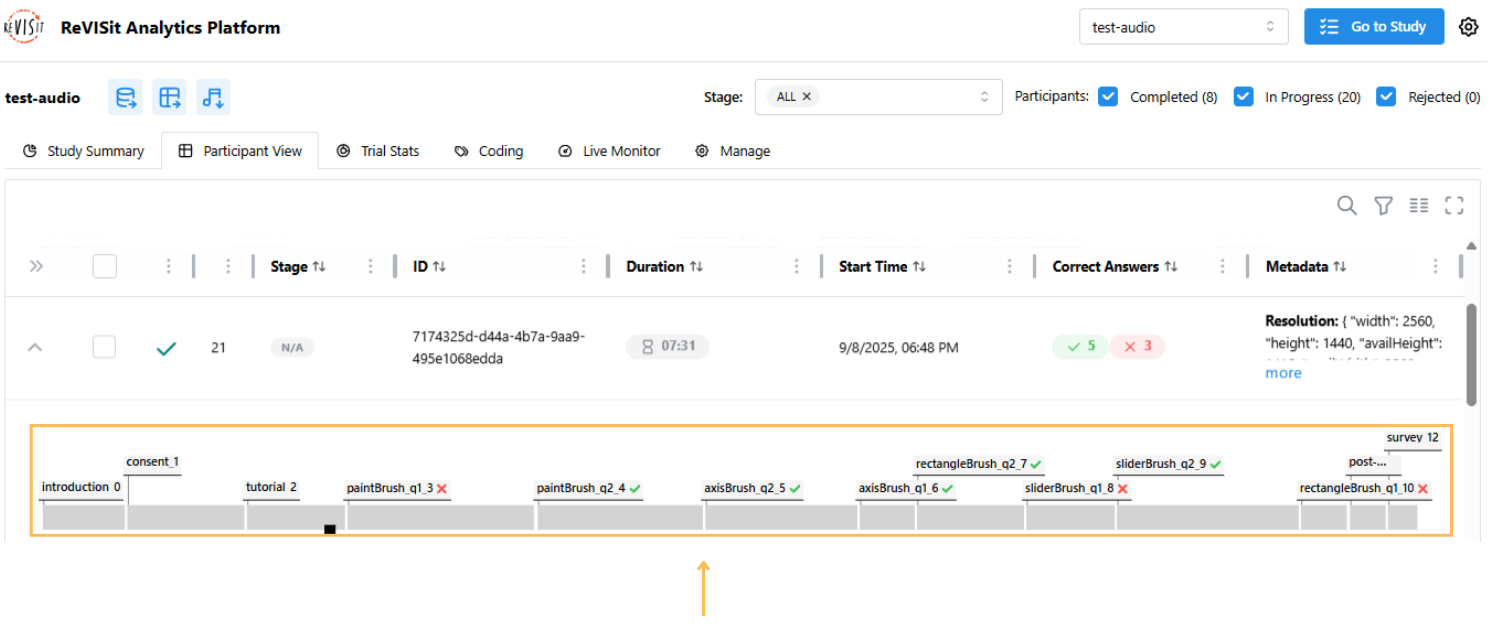
Download Single Participant's Task Audio
-
Navigate to the Analysis platform for the current study.
-
Open the Participant View, then expand the participant’s timeline by clicking the expand button.

-
Click on the task.
-
Click on the Download Audio button.
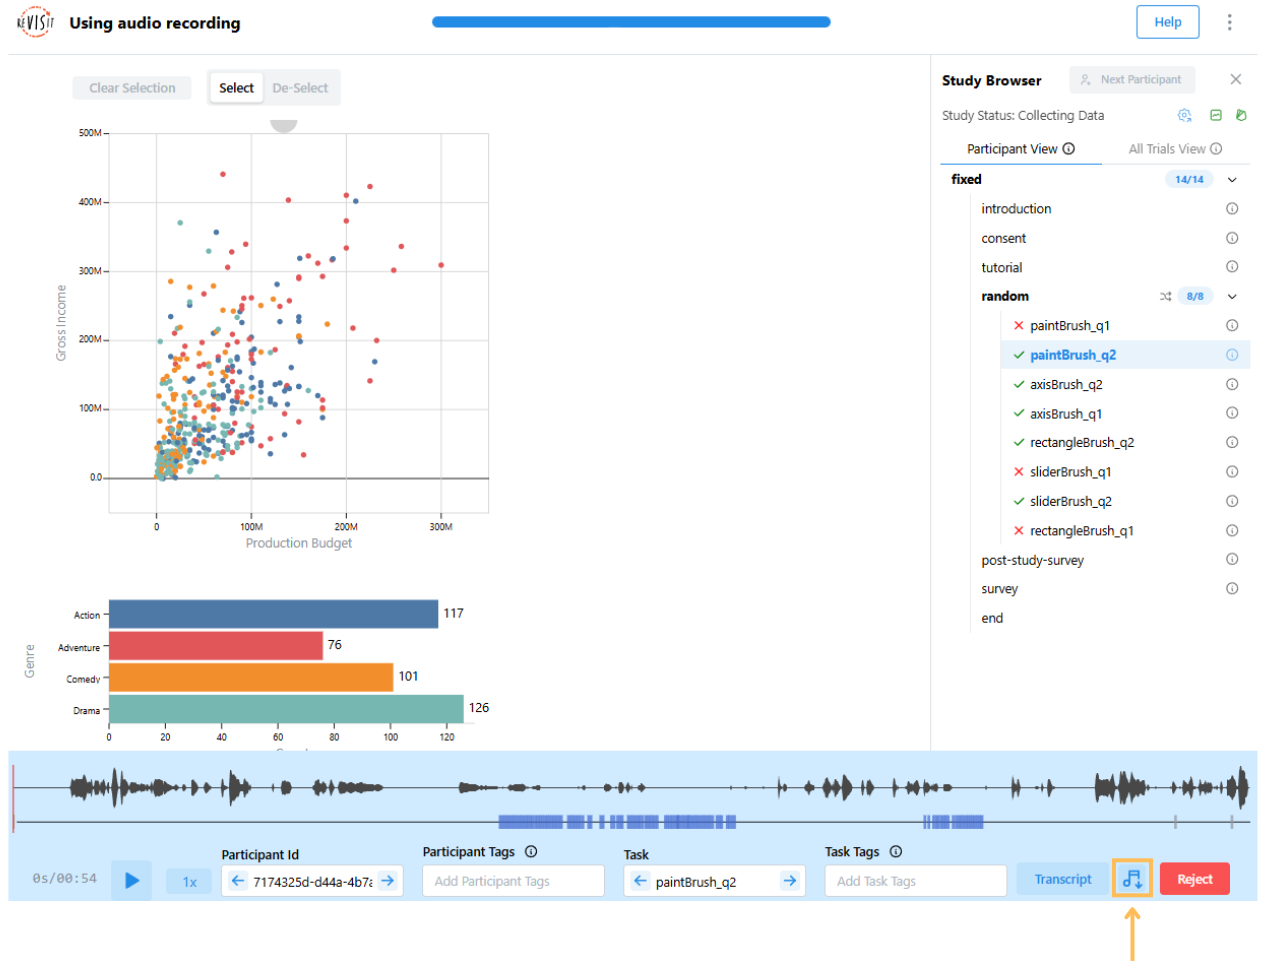
If you are using Firebase with the Google Cloud Speech-to-Text extension configured, it will download the transcript of the audio file as well.
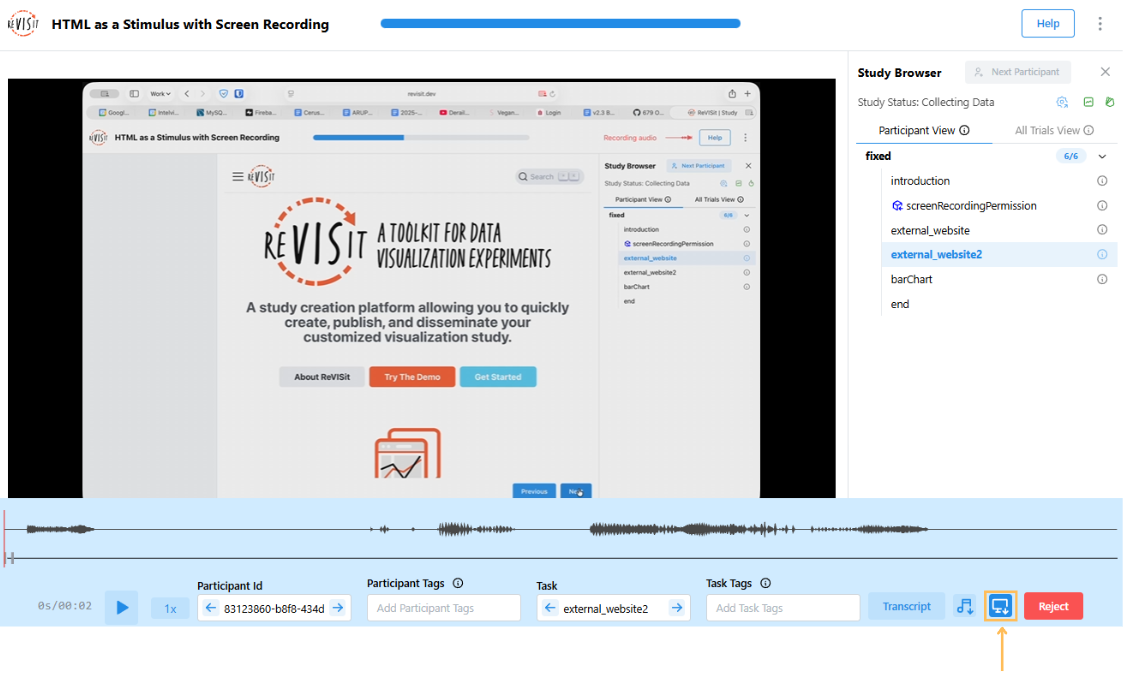
Download Screen Recording
There are two ways to download screen recording video files if you have enabled recordScreen: true in your study. For applying screen recording feature in your study, please visit Record Screen.
Download Participants' Screen Recording
-
Navigate to the Analysis platform for the current study.
-
Open the Participant View, then click on the Download participants' screen recording button.
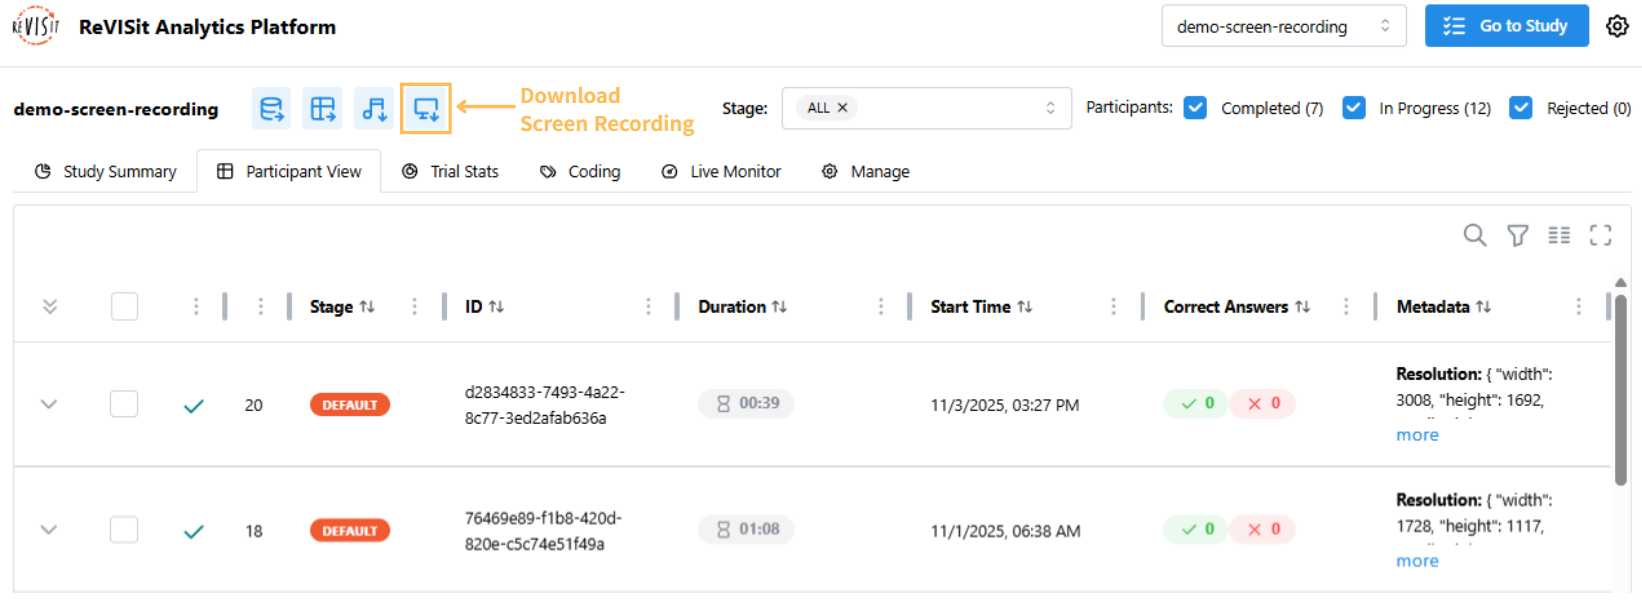
To download screen recording from specific participants, select the participants in the table.
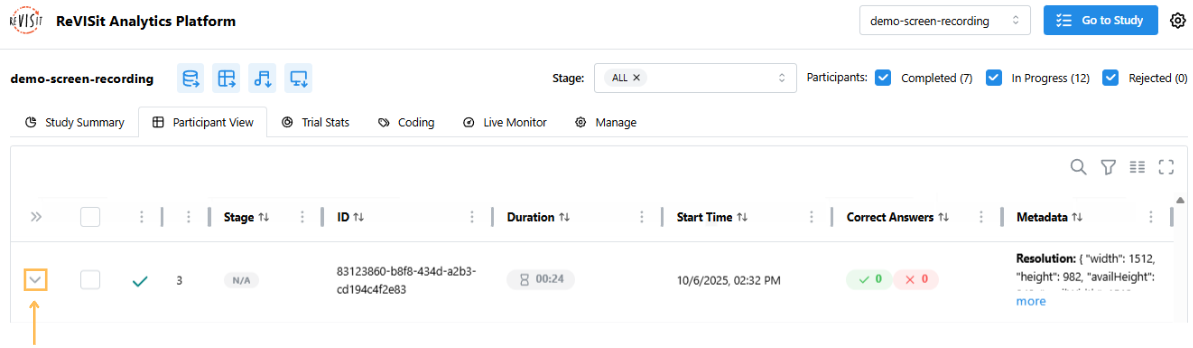
Download Single Participant's Screen Recording
-
Navigate to the Analysis platform for the current study.
-
Open the Participant View, then expand the participant’s timeline by clicking the expand button.
-
Click on the task.
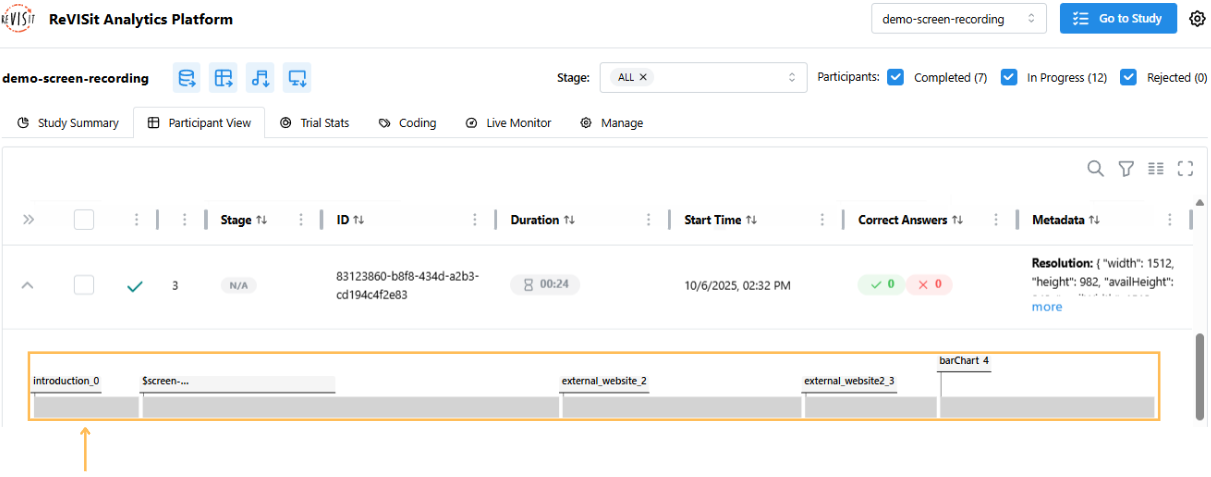
-
Click on the Download Screen Recording button.