ReVISit v2.3: Databases, Screen Capture, Qualitative Analysis, Styling, and More!
Today we're announcing several new reVISit features that were released in versions 2.1, 2.2 and 2.3. Major new features include an option to self-host data, remote screen-capture, a collaborative qualitative coding interface, and other features and improvements we're excited to share. For full details on the changes, look at the GitHub releases!
Supabase – A Self-Hosted Alternative to Firebase [Beta]
Maybe the biggest change is added support for Supabase, an open-source, self-hostable alternative to Firebase. Not all researchers can use products such as Firebase due to organizational or legal restrictions (GDPR, etc.). Supabase allows researchers with these restrictions to use ReVISit inside an environment they fully control and own. Self-hosting is a bit more hands-on than using Firebase, so we make the setup as easy as possible by providing a docker-compose file to spin up Supabase on your own infrastructure. See Supabase setup guide to learn more.
Note: we ran a few studies with Supabase without issues, but we don’t have as much experience with it as we do with Firebase, so we're marking this feature as Beta until we have had more time to test with it.
Screen Capture [Beta]
Since its initial release, reVISit has included provenance tracking using Trrack. Provenance tracking can be very helpful for replaying and analyzing exactly how users interact with stimuli. However, it can also be tedious to setup – especially for complex visualizations with multiple elements to track, or when working with visualizations you don’t control (e.g. website components).
So today we’re introducing a flexible alternative for capturing user behavior: screen recording. In your study, you now can ask participants to grant browser permissions to record their screen – much like screen sharing in video conferencing software – with recordings stored in the reVISit infrastructure. This approach offers a much lower barrier to setup compared to provenance tracking and can be enabled directly through the reVISit config – no coding required!
The video shows an example screen recording session that also includes audio recording in a think-aloud protocol.
We’re finding screen recording to be extremely useful for early-stage piloting, debugging, as well as conducting full studies. In fact, if you have other reVISit capabilities enabled, such as think-aloud or provenance tracking, the screen recording syncs properly with them, making it powerful to analyze provenance as participants experience it. See the Screen recording setup guide to learn more. As with Supabase, we’re marking this feature as Beta until we have had more time to test with it.
Qualitative Coding for Study Replays
We’ve added a qualitative analysis and coding platform to pair with our participant analysis and replay. This implementation based on what we described in our CHI paper, with extensive design improvements and additional functionality. The analysis displays the transcribed text for a participant and task, and allows users to edit the transcriptions as well as create and apply codebooks to the transcribed audio.
The video shows an example of audio and video captured in a visualization drawing task, with the researcher applying codes to segments of the transcript.
Codes are available for download as part of the data export, making it easy to integrate qualitative coding into your analysis workflow.
Styling Studies
We introduce new tools for customizing the look of the studies, making it easier to match your study’s design to your research goals. Whether you want to make your study polished or improve accessibility for participants, you can do it all directly with the styling options reVISit provides. Styling can be applied in multiple ways – from inline styles to external CSS files, depending on the level of customization you need.
Styles can be set at the global level for the whole study, at the component level for individual stimuli, or at the response (form element) level for specific questions.
With styles, you can get really into the design weeds. For instance, you can make reVISit feel deeply polished by adjusting the form style study, using clean layouts, different font sizes, and bordered responses. The video shows a study emulating Google Forms’ style:
You can try it out and look at various other examples here.
Advanced styling can be applied to make studies more engaging. For example, responses can enlarge text as participants start typing or change background when clicked. These interactions make study more engaging, providing a more user-friendly experience.
Styling allows researchers to create clean, accessible, and enjoyable studies without complicated steps. To see more styling examples, check out the styling documentation.
Live Monitor for Viewing Study Progress
We added a new live monitor to the analytics interface. The monitor maintains a live connection to the database, and the moment participants answer a question, the heatmap and progress are updated automatically. This enables you to track participants’ progress without refreshing the page. For studies that have fixed-length trials, it displays all questions and marks answered questions in green. For studies that have dynamic components, it will show answered questions followed by a question mark since the total number of questions is not pre-determined. Note that the live monitor is currently only supported in Firebase-based studies.
The video shows the live monitor in action: in the left video, a participant is taking the study, and on the right, the live monitor updates automatically as the participant answers questions. We show both, a static and a dynamic study example.
Study Stages
A typical study goes through multiple stages, such as debugging by the developer, pre-pilots with friends and family; pilots with real participants and then finally the main study. In data analysis, you do want to keep these stages separate to avoid mixing pilot data with real data. To simplify this process, we introduce a new stage management feature.
You can now create stages and filter participants by their stage in the analysis interface. Stages are also prominently available in the data that you download from reVISit. By default, the study will be in the DEFAULT stage. Study designers can create new stages and give it a color, which will be assigned to new participants. In the table in the participant's view, we added a new column that displayed the stage name with corresponding color.
Advanced Control Over Study Flow With Dynamic Sequence Blocks
Dynamic blocks enable a study designer to build studies that require adaptive logic, i.e. the response to a question (e.g., right or wrong) can be used to determine the next (e.g., harder or easier) question.
You can check out a simple demo here, or look at a real study on just noticeable differences of correlations we recently ran.
To learn how to use the dynamic blocks in your studies, see the documentation.
Study Summary Page
We introduce a study summary page in the analysis interface. This provides a comprehensive overview of the study data in a single dashboard. The summary is organized in three sections – Overview Statistics, Component Statistics, and Response Statistics.
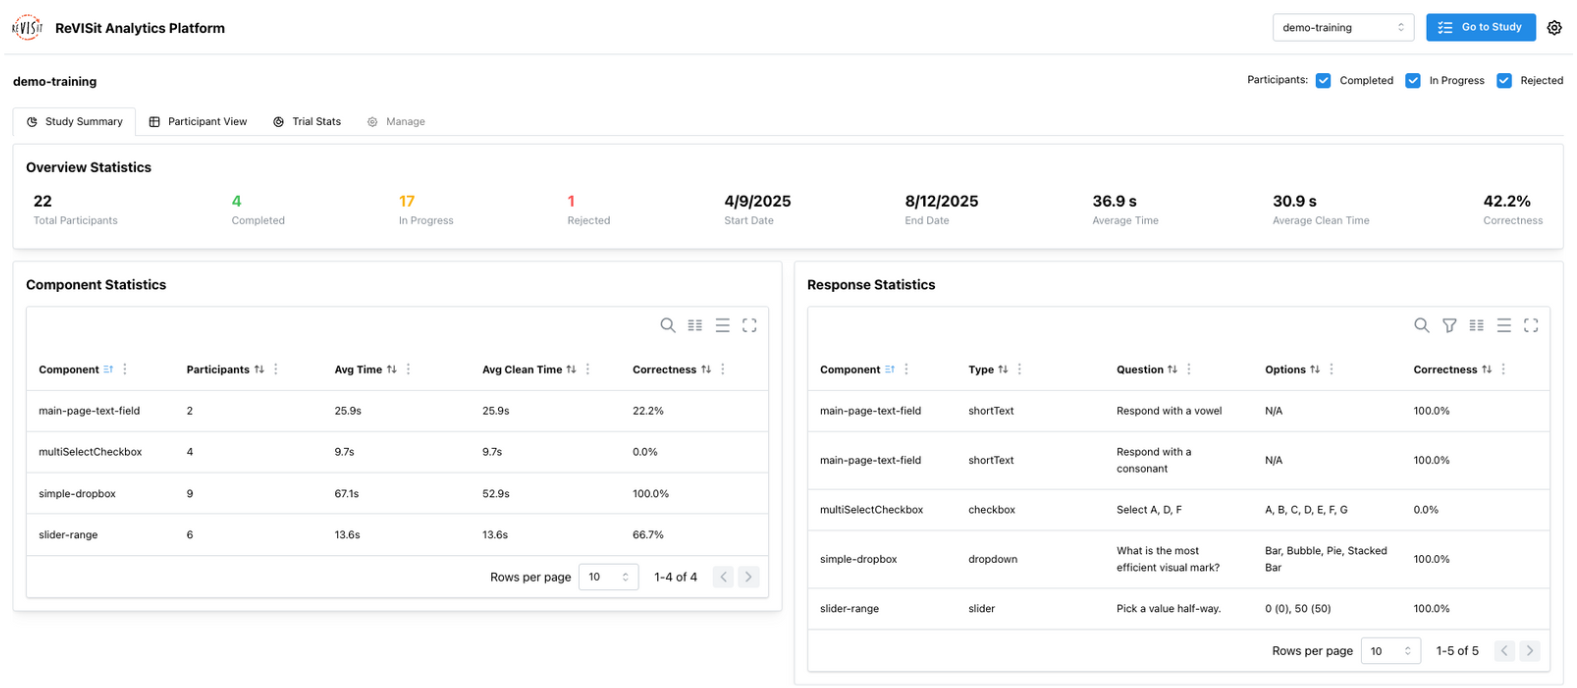
- Overview Statistics show key information about the study, such as the total number of participants, study timeframe, average time spent, and the overall correctness of the study.
- Component Statistics give details about each component of the study, such as number of participants, average time spent, and correctness.
- Response Statistics show response level information including response type, answer options, and correctness.
This new summary page will help you understand participants' answers quickly. To learn more, please see the documentation.
New Libraries
The reVISit libraries are a growing collection of predefined study components and validated questionnaires for visualization and HCI research. With just a few lines of code, you can import them directly into your study.
We are excited to introduce several new libraries:
Virtual Chinrest Calibration Library
A virtual chinrest can be used to measure the distance between a participant and their monitor by detecting their blind spot. This reVISit library implementation was created by Sheng Long, and is the first community contribution!
Visualization & Literacy Assessments
We have added the Berlin Numeracy Test (3 versions), Graph Literacy Scale, CALVI (Critical Thinking Assessment for Literacy in Visualizations), and Adaptive Visualization Literacy Assessment Test (A-VLAT). The Berlin Numeracy Test (adaptive version) and A-VLAT take advantage of our new dynamic block feature, which supports adaptive logic, so the questions shown depend on participants’ previous answers.
Usability and Workload Measures
We have added the QUIS (Questionnaire for User Interaction Satisfaction), SAM (Self-Assessment Manikin for affective reactions, and SMEQ (Subjective Mental Effort Questionnaire). We’ve also updated NASA-TLX by adding the Source of Workload Evaluation, as recommended in the original NASA TLX manual.
Screen Recording Component
We also added a component that asks for screen recording permissions as a library. This is in support of the screen recording feature discussed above.
New Components and Component Features
Video Stimulus
In 2.1, we’ve added a video stimulus component, allowing participants to view video directly within the study. The video component supports both local videos or external video, with an option to force participants to watch the video which is useful to ensure that they watched the video before proceeding to answer the question. You can also add a timeline to the video to allow participants to skip to specific parts of the video. For more information please see the docs.
Ranking Widget
In 2.3, we’ve added the ranking widget, which allows participants to order or group items. This ranking component is useful for study designers who want to capture participants’ priorities, preferences, or how they categorize different items. There are three types of ranking widgets that you can use depending on your study goals.
- Ranking Sublist lets participants rank items in a single list, which is useful when you want them to focus on the relative order of their choices.
- Ranking Categorical enables participants to rank items within high, medium, and low categories, which is useful when you want to understand which category an item belongs to rather than looking into the precise order.
- Ranking Pairwise lets participants rank items by comparing them in high and low pairs, instead of ordering every item at once. To learn more about how to use a ranking widget, refer to our docs.
Multiselect Dropdown
The multiselect dropdown response became available in version 2.3. Previously, reVISit only offered a standard dropdown that allowed participants to select a single option. The multiselect dropdown enables participants to select multiple options. A dropdown response will automatically render as a multiselect dropdown if you define min or max selections in the configuration. Learn more about dropdown response in the docs.
Random Order of Form Elements and Options
In 2.2, we added a randomization feature for form elements and options to help reduce bias and improve the quality of study results. This feature allows individual questions, answer choices, or entire pages of questions to show up in random order for each participant, which is also recorded for replay. For more details on using randomization in studies, visit our docs.
Previous Buttons
Previously, participants were not allowed to go back in the study to change or correct their answers. In version 2.2, we added a previous button that allows participants to navigate back to earlier questions, if the study designer allows them to review and make corrections to their answers.
New Configuration Options and Analysis Interface Updates
Screen Size Restrictions
ReVISit now allows you to set minimum screen size requirements to ensure participants have enough space to view study content and complete tasks. When a participant starts a study, reVISit checks their browser size and shows a warning page until the participant resizes their browser. If the requirements are not met within a time frame, the participant is automatically rejected. To learn more about how to apply screen size restriction to your study, please refer to the documentation.
Analysis Audio, Screen Recording and Transcript (Firebase) Download
ReVISit lets researchers capture and analyze participants' audio and screen recordings. Audio and transcripts, and screen recordings can now be downloaded for all participants or selected participants from the Participant View or Replay where previously you had to access these sources via Firebase.