Designing a React Stimulus
React is a popular JavaScript library for building user interfaces, primarily for single-page applications. You can find more details on the official React documentation.
Here we will introduce how to create a React stimulus for reVISit studies through two examples.
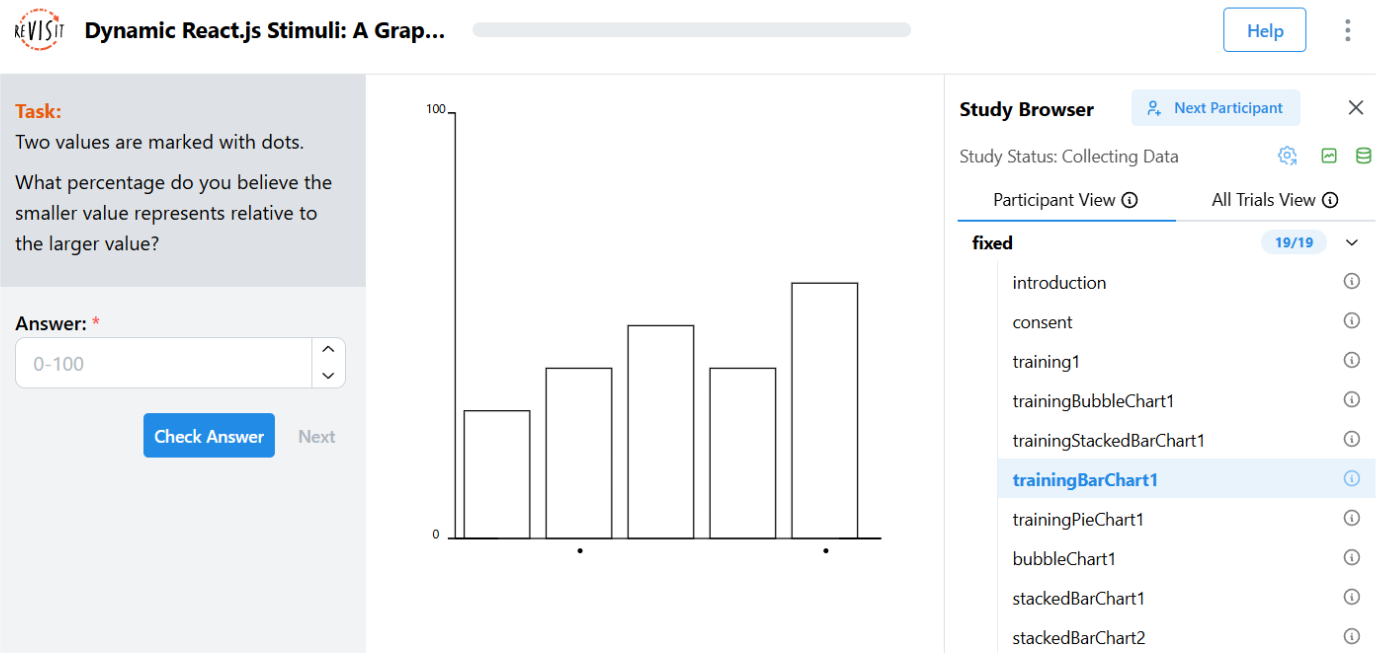
Example 1 is a stimulus from the graphical perception experiment. This example will demonstrate how to pass data from the config file to the stimulus.
Example 2 is a Stroop color experiment. This example will demonstrate how to retrieve user answers from the React component using the reactive response type.
Example 1: Graphical Perception Experiment
The React component stimulus should be put into the src/public/your-exp-name/assets folder. As stated in other tutorials, we suggest always making an assets directory inside your experiment directory for the best organization possible. In our example, we name the experiment "example-cleveland," so we put this code into src/public/example-cleveland/assets/BarChart.tsx. Please replace it with another experiment name.
We have a few reusable components and hooks available in the src/public/example-cleveland/assets/hooks and src/public/example-cleveland/assets/chartcomponents folders, which are required in this demo. These reusable components and hooks help creating charts using D3.js in React. You may copy them to your own experiment folder.
Please note, there is a "parameters" prop in the BarChart component. This is used to pass data from the config file to the React component. In this example, we pass two data arrays to the BarChart component. One is the data array contains 5 objects, each object has a name and a value. The other is the selectedIndices array, which contains the indices of the data array that we want to highlight with dots.
import * as d3 from 'd3';
import { useChartDimensions } from './hooks/useChartDimensions';
import { Bars } from './chartcomponents/Bars';
import { NumericAxisV } from './chartcomponents/NumericAxisV';
import { OrdinalAxisHWithDotMarks } from './chartcomponents/OrdinalAxisHWithDotMarks';

// Chart dimensions
const chartSettings = {
  marginBottom: 40,
  marginLeft: 40,
  marginTop: 15,
  marginRight: 15,
  width: 400,
  height: 400,
};

// This React component renders a bar chart with 5 bars and 2 of them highlighted by dots.
// The data value comes from the config file and pass to this component by parameters.
function BarChart({ parameters }: { parameters: any }) {
  const tickLength = 6;
  const [ref, dms] = useChartDimensions(chartSettings);

    // Define axis scales
    // Data comes from parameters is used here
  const xScale = d3
    .scaleBand()
    .domain(parameters.data.map((d: { name: any }) => d.name))
    .range([0, dms.boundedWidth])
    .padding(0.2);

  const yScale = d3
    .scaleLinear()
    .domain([100, 0])
    .range([0, dms.boundedHeight]);

  // Define ticks
  const yAxisTickFilter = (ticks: any[]) => ticks.filter((t, i) => i === 0 || i === ticks.length - 1);

  // selectedIndices is used here to draw dots on the x-axis
  const xAxisTickFilter = (ticks: any[]) => ticks.filter((t, i) => parameters.selectedIndices.includes(i));

  return (
    <div className="Chart__wrapper" ref={ref} style={{ height: 400 }}>
      <svg width={dms.width} height={dms.height}>
        <g
          transform={`translate(${[dms.marginLeft, dms.marginTop].join(',')})`}
        >
          <g
            transform={`translate(${[tickLength, dms.boundedHeight].join(
              ',',
            )})`}
          >
            <OrdinalAxisHWithDotMarks
              domain={xScale.domain()}
              range={xScale.range()}
              withTick
              tickLen={0}
              tickFilter={xAxisTickFilter}
            />
          </g>
          <g transform={`translate(${[0, 0].join(',')})`}>
            <NumericAxisV
              domain={yScale.domain()}
              range={yScale.range()}
              withTick
              tickLen={tickLength}
              tickFilter={yAxisTickFilter}
            />
          </g>
          <g transform={`translate(${[0, 0].join(',')})`}>
            <Bars
              data={parameters.data}
              xScale={xScale}
              yScale={yScale}
              height={dms.boundedHeight}
            />
          </g>
        </g>
      </svg>
    </div>
  );
}

export default BarChart;
In the config file, we will set parameters for the BarChart component. The parameters contain data and selectedIndices. Both are decoded in the above code and used to create the stimulus.
The parameters are an object; you can change the format to suit your needs.
"barChart": {
  "meta": {
    "difficulty": 5,
    "chart": "Bar"
  },
  "description": "A chart with correct answer of 0.66",
  "instruction": "Two values are marked with dots. \n\nWhat percentage do you believe the smaller value represents relative to the larger value?",
  "type": "react-component",
  "path": "example-cleveland/assets/BarChart.tsx",
  "response": [
    {
      "id": "barChartAnswer",
      "prompt": "Your answer (1-100):",
      "required": true,
      "location": "belowStimulus",
      "type": "numerical",
      "min": 1,
      "max": 100
    }
  ],
  "parameters": {
    "data": [
      {
        "name": "A",
        "value": "30"
      },
      {
        "name": "B",
        "value": "40"
      },
      {
        "name": "C",
        "value": "50"
      },
      {
        "name": "D",
        "value": "40"
      },
      {
        "name": "E",
        "value": "60"
      }
    ],
    "selectedIndices": [
      1,
      4
    ]
  }
}
Example 2: Stroop Color Experiment (with reactive response)
When building experiments with React, we can allow users to interact with a component to answer questions. In this example, we will build a Stroop color test using a React component and a reactive response type.
In the Stroop color test, you are required to identify the color of the word, not what the word says. For example, for the word RED printed in blue ink, you should type 'BLUE.' The text content and text color are passed from the config file through parameters.
The component uses:
parametersfor trial-specific values (displayText,textColor,taskid)setAnswerto send typed responses to reVISitreactiveresponse in config
We will use demo-react-trrack as the experiment name. Create the React stimulus file in src/public/demo-react-trrack/assets/.
import { useCallback, useState } from 'react';
import {
  Box, Center, Stack, Text, TextInput,
} from '@mantine/core';
import { StimulusParams } from '../../../store/types';

/** Trial parameters from config: displayText and textColor */
interface StroopTrialParams {
  displayText?: string;
  textColor?: string;
}

/** Normalize input to uppercase for consistent answers */
const toCapped = (value: string) => value.toUpperCase();

// eslint-disable-next-line @typescript-eslint/no-explicit-any
function StroopColorTask({ parameters, setAnswer }: StimulusParams<any>) {
  const { taskid } = parameters;
  const { displayText = '', textColor = 'black' } = parameters as StroopTrialParams;

  const [responseText, setResponseText] = useState('');

  // Update local state and pass to reVISit
  const updateAnswer = useCallback((value: string) => {
    setResponseText(value);
    setAnswer({
      status: value.trim().length > 0,
      answers: { [taskid]: value },
    });
  }, [setAnswer, taskid]);

  return (
    <Stack gap="xl" style={{ maxWidth: 520, margin: '0 auto' }}>
      {/* Display the Stroop word in the configured color */}
      <Center>
        <Box>
          <Text fw={700} size="2rem" style={{ color: textColor }}>
            {displayText}
          </Text>
        </Box>
      </Center>
      {/* Text input for participant's color response */}
      <Center>
        <TextInput
          value={responseText}
          onChange={(event) => {
            const value = toCapped(event.currentTarget.value);
            updateAnswer(value);
          }}
        />
      </Center>
    </Stack>
  );
}

export default StroopColorTask;
Below is a minimal config with two Stroop trials. Each trial passes displayText (the word shown) and textColor (the color of the text) via parameters. The reactive response type receives the typed answer from the component.
{
  "baseComponents": {
    "trial": {
      "description": "identify the text color in a Stroop trial",
      "instruction": "In this experiment you are required to say the color of the word, not what the word says. For example, for the word, RED, you should say \"Blue.\"",
      "type": "react-component",
      "path": "demo-react-trrack/assets/DemoReactTrrack.tsx",
      "nextButtonLocation": "sidebar",
      "response": [
        {
          "id": "stroopAnswer",
          "prompt": "Your typed Stroop color response",
          "location": "sidebar",
          "type": "reactive"
        }
      ]
    }
  },
  "components": {
    "trial-red-blue": {
      "baseComponent": "trial",
      "parameters": {
        "displayText": "RED",
        "textColor": "blue"
      }
    },
    "trial-green-pink": {
      "baseComponent": "trial",
      "parameters": {
        "displayText": "GREEN",
        "textColor": "pink"
      }
    }
  },
  "sequence": {
    "order": "fixed",
    "components": ["trial-red-blue", "trial-green-pink"]
  }
}
Adding provenance tracking
To record user interactions and enable replay, you can add provenance tracking with Trrack. This involves:
- Creating a Trrack registry and actions for state changes
- Passing
provenanceGraphinsetAnswerso reVISit stores the provenance - Using
provenanceStateto restore the textbox during replay
For a full walkthrough, see the Provenance Tracking tutorial.